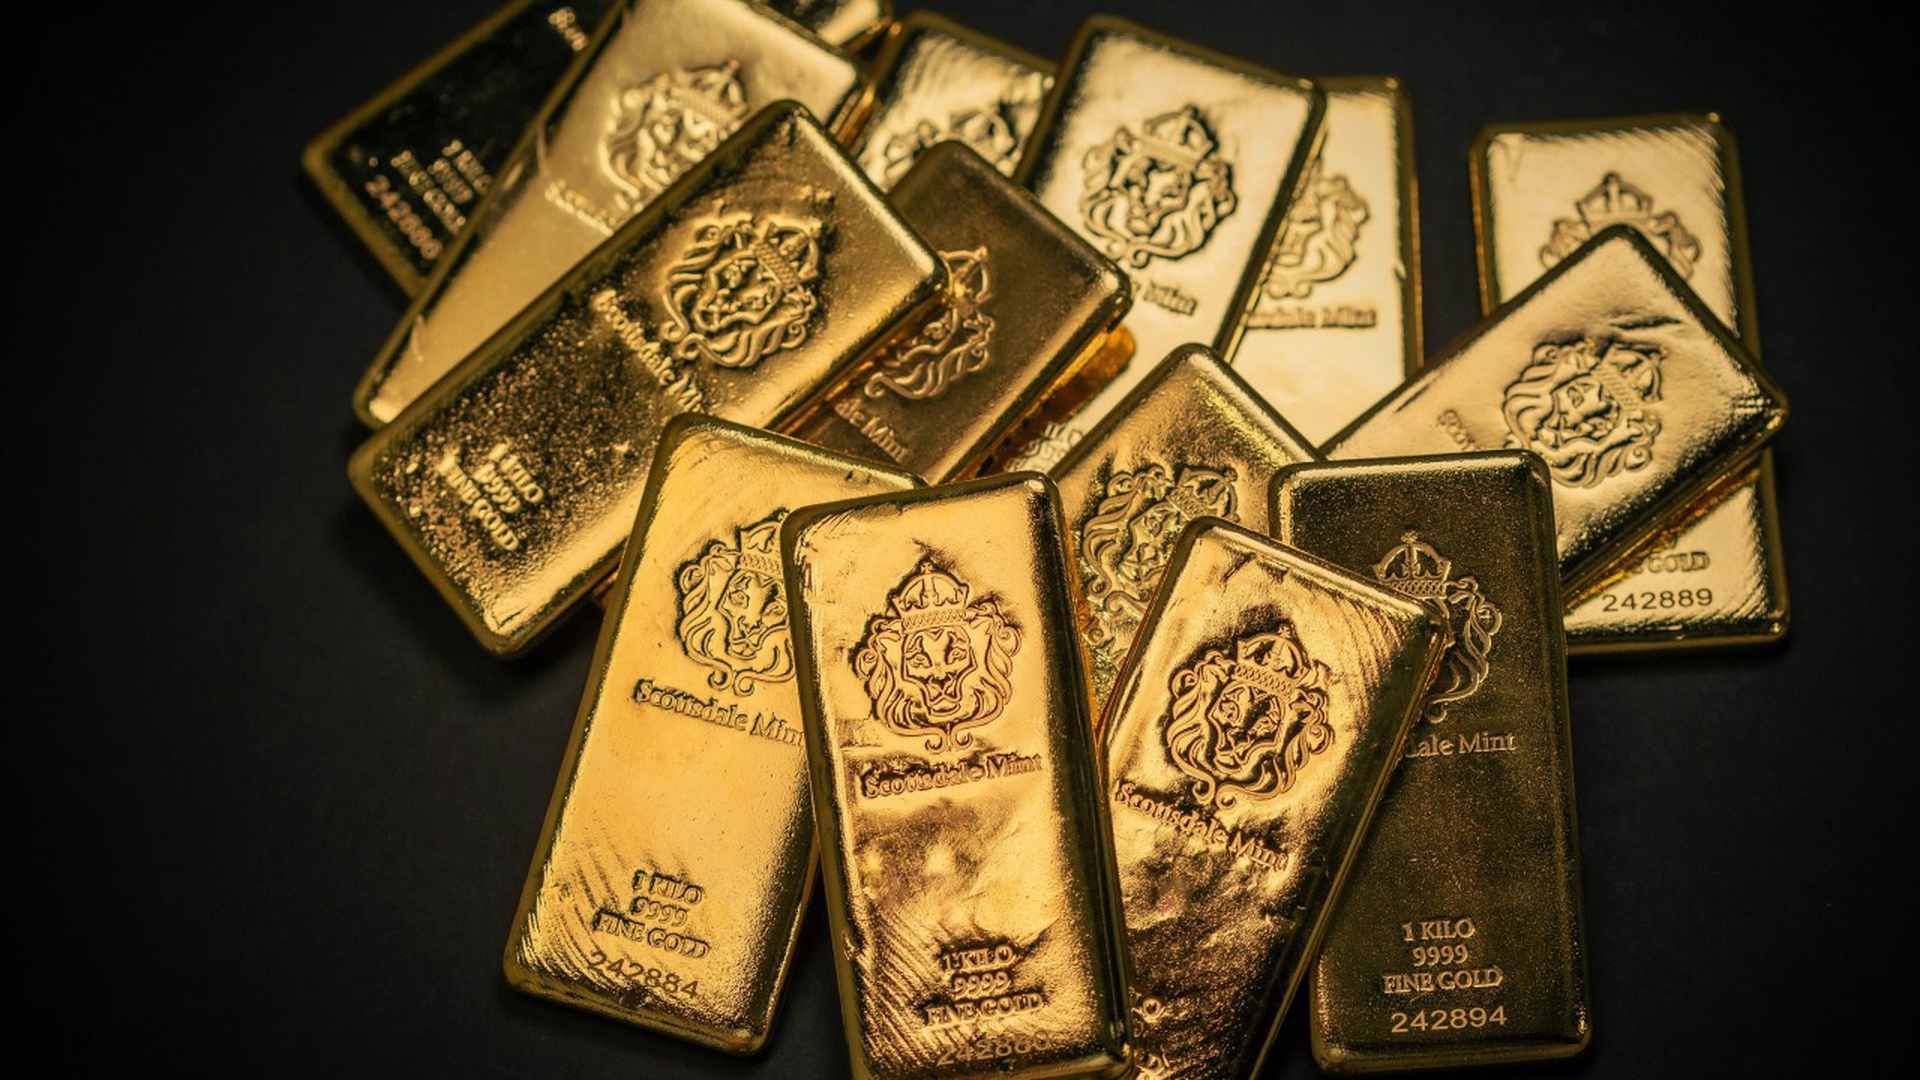
Gold price volatility surged in the first half of 2026, delivering one of the most dramatic round trips in the metal's recent history. After touching an all-time intraday high of $5,595 per ounce on January 29, gold spent the following months under persistent pressure, trading down to a year-to-date low of $3,943 on June 30 before closing the month just above the psychologically important $4,000 mark at $4,008.02. The metal declined 14.14% in June alone and finished the first half down 7.21% year-to-date, a pullback of roughly 25% from its January peak.
Gold equities, as expected during a period of falling gold prices, lagged the metal. The MarketVector™ Global Gold Miners Index (MVGDX) fell 15.54% in June and was down 12.41% year-to-date. Silver fared no better, closing a recent week at $55.96 per ounce as the gold-to-silver ratio climbed to 71:1, a classic sign of reduced risk appetite, as gold typically outperforms silver during corrections. Yet perspective matters: gold stocks remain one of the best-performing asset classes over the past year, and gold itself continues to outperform most major asset classes over that period.
The dominant narrative behind gold's decline has become self-reinforcing, and it begins with oil. Since the outbreak of the war with Iran, elevated oil prices have kept inflation expectations high. Elevated inflation expectations have kept the Federal Reserve on hold and increasingly tilted toward hiking. A hawkish Fed keeps real yields elevated, and elevated real yields support the U.S. dollar, while a strong dollar weighs on non-yielding gold.
This dynamic was on stark display in late July. Spot gold traded between $4,001 and $4,008 on July 20, down more than 3% for the week, its worst weekly decline in over a month despite a sixth consecutive night of U.S. strikes on Iranian military targets, a renewed naval blockade of Iranian shipping, and Iranian missile strikes on two tankers in Omani waters. Developments that would normally ignite safe-haven demand instead saw gold briefly slip below $4,000 for the first time in months. The message was clear: rate expectations, not geopolitical headlines, are the main driver.
Fed officials have reinforced that pressure ahead of the July 28–29 meeting. Dallas Fed President Logan called for another hike; Governor Jefferson backed tighter policy if inflation persists; and Cleveland's Hammack flagged elevated inflation risks. Strong retail sales and rising Treasury yields pushed September rate-hike odds to 53% from 47%. Meanwhile, the apparent winding down of the broader Middle East conflict at the end of June further eroded gold's safe-haven bid, as markets shifted decisively risk-on and equities pushed toward fresh highs.
The key sequence to watch from here runs from oil prices to inflation expectations to Fed rate expectations and finally to real yields and the dollar. A resolution in the Strait of Hormuz could reverse the entire chain in gold's favor; further escalation could keep the metal under pressure until safe-haven demand finally overwhelms the drag from higher real yields.
Unsurprisingly, commodity analysts have reduced their 2026 gold forecasts. Goldman Sachs cut its year-end 2026 target to $4,900 from $5,400 after pushing back its expected timing for the Fed rate cuts, with a downside case of $4,400 if the Fed actually delivers a hike rather than merely signaling one.
Even so, the revised consensus remains well above current prices. Bloomberg's mean estimates put average annual gold prices around $4,700 for 2026 and 2027 and above $4,000 for 2028 and 2029. Goldman Sachs, Citigroup, and Deutsche Bank all forecast gold at or above $5,000 in 2027. The World Gold Council's valuation framework pegs fair value near $4,100 per ounce (±5%), broadly in line with where the metal now trades. Notably, even bearish sell-side scenarios assume continued central bank buying will limit the downside. (Forecasts are not reliable indicators of future performance.)
If Western investors have been the sellers of this correction, central banks have been the steady buyers beneath it. World Gold Council data show official-sector net monthly buying near record levels, with 89% of surveyed reserve managers expecting global gold reserves to rise over the next 12 months and a record 45% expecting their institutions to add. Gold has now overtaken U.S. Treasuries as the world's largest reserve asset. China added 14.93 tonnes to its reserves in June, its largest monthly purchase since October 2023 and its 20th consecutive month of buying even as gold posted its worst quarterly decline since the 2013 taper tantrum. The lesson: central banks buy for long-term strategic diversification, not short-term price signals, and their demand should be assessed separately from rate-sensitive investment flows.
The East-West divide extends to private investors. While Western investors have continued trimming gold ETF exposure, Eastern buyers have been adding both physical bullion and gold-backed products throughout the pullback. Even the Western selling shows signs of exhaustion: SPDR Gold Shares recorded $14.4 billion in net outflows from March 1 to July 16, but outflows slowed to just $46 million through mid-July, and a recent $446.8 million weekly inflow lifted shares outstanding by 0.3%. Historically, gold has performed well when central bank activity and investment demand together exceed 30% of total demand, and a return of Western investor participation, as occurred in 2025, could provide the next leg of support.
For investors rattled by the correction, history offers useful context. The famous 1970s gold bull market was technically two bull markets separated by a brutal two-year bear. Gold rose from $35 to $195 per ounce between 1971 and 1974, then fell 48% to around $100 by late 1976 before ultimately rallying to over $850 by 1980. In August 1976, near the bottom, Time magazine ran "The Great Gold Bust," citing successful U.S. efforts to demonetize gold, IMF gold auctions, a steadying dollar, and cooling inflation. Investors who sold on that narrative locked in profits and missed an 8x gain. Another, larger wave of inflation was coming; each of the decade's three inflation waves proved progressively bigger, and the bull market only ended when Paul Volcker jacked rates to roughly 20% in 1980.
Today's setup differs in important ways, mostly in gold's favor. In the 1970s, governments and central banks were major sellers; today they are aggressive buyers. U.S. debt-to-GDP stood around 35% then; it exceeds 120% today, with the national debt having just surpassed $39.5 trillion. Trade and currency wars are raging, and policymakers are relying on half measures rather than Volcker-style resolve. A 48% drawdown seems unlikely, and this correction may prove shorter. Still, the episode reinforces that even powerful bull markets include punishing downturns and that the biggest gains historically went to those who held through them or bought the dips rather than trying to trade every swing.
Beyond price action, the precious metals conversation was enlivened by Treasury Secretary Scott Bessent, whose televised comments suggested outstanding silver certificates remain backed by silver at Fort Knox, drawing swift criticism from analysts who noted the U.S. ended silver redemption in 1968 and holds no official silver reserves. The episode revived attention on the dollar's long-run loss of purchasing power (a dollar today buys a fraction of the silver it commanded six decades ago) and reignited debate over Fort Knox gold audits and sovereign reserve transparency, with comparisons drawn to EU official holdings.
The Treasury also announced a commemorative $1 coin featuring President Trump for America's 250th anniversary. Despite its golden appearance, it contains no gold, a timely reminder of the distinction between commemorative coinage and investment-grade bullion.
Silver's next move may hinge on speculative participation: COMEX futures volumes have quieted considerably from earlier in the year, suggesting a sustained recovery may require leveraged traders to return. For gold, the Strait of Hormuz remains the pivotal variable through month-end, arguably more important than the Fed's July 29 decision itself. A ceasefire or reopened shipping lanes could lower oil prices, ease inflation and rate expectations, and support gold; further escalation could extend the pressure until safe-haven flows finally dominate. The overall situation, however, remains unchanged. A prolonged "Fed on hold" environment could eventually deliver lower or even negative real rates, historically among the most favorable backdrops for gold.