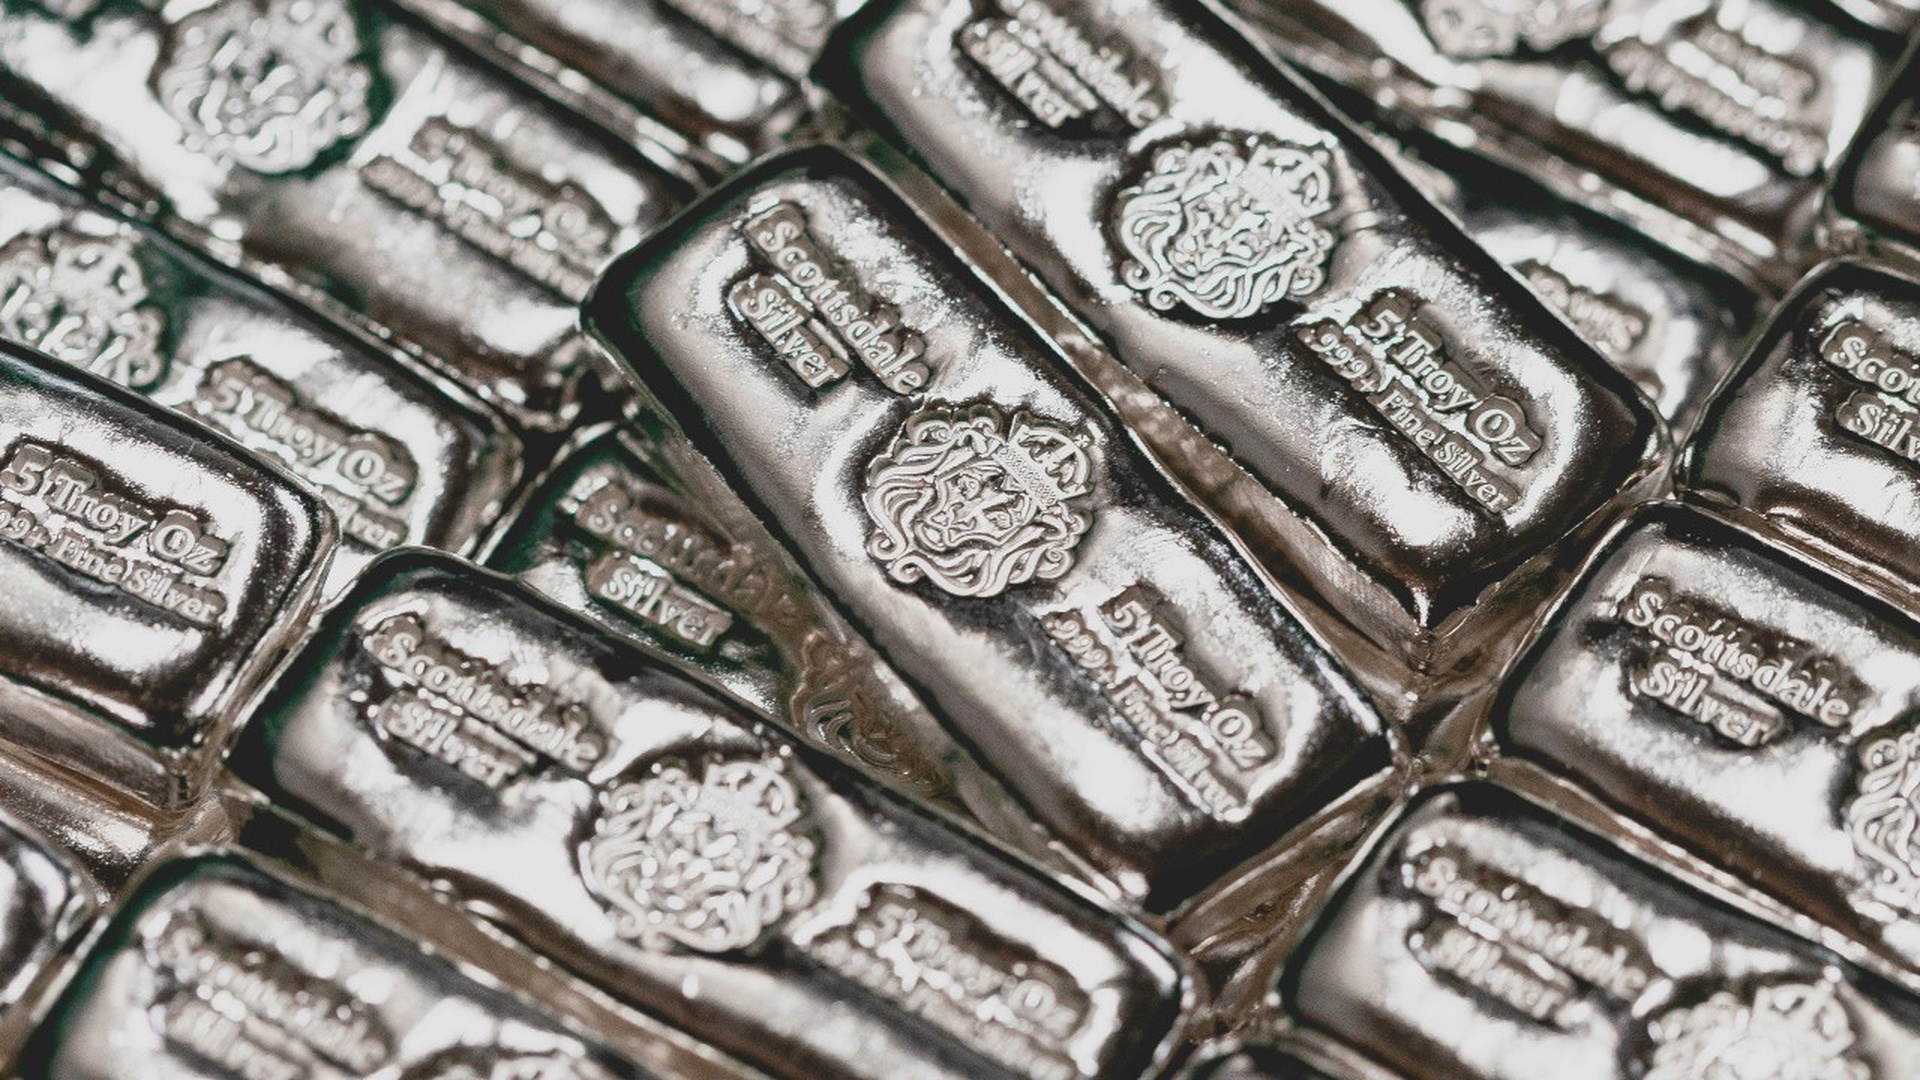
The silver market has just experienced one of its most volatile periods in recent history. In January, the price surged to an unprecedented $121.62, carried by the euphoria of a broader precious-metals bull market that also drove gold to a peak near $5,600. A brutal correction followed, roughly 52% for silver, while gold gave back around 30% before finding repeated support at the $4,000 mark, where it now trades near $4,080.
Three factors combined to trigger the sell-off: a deeply divided U.S. central-bank committee that put further rate hikes back on the table; a hot May inflation print of 4.2%, which reinforced restrictive expectations; and silver's high industrial share, which makes the metal more sensitive to growth worries than gold. Traders currently price a 64% chance of a Fed hike by September, according to the CME FedWatch tool, even as the central bank is widely expected to hold rates at its 29 July meeting.
The geopolitical backdrop has hardly helped sentiment. The US-Iran war has ground into its tenth consecutive day of strikes, with Yemen's Houthis warning ships away from Saudi ports and mediators pushing a 10-day ceasefire proposal to salvage the June 17 interim deal.
Yet one point is easily obscured by the short-term price action: none of these triggers changed the underlying supply-and-demand picture. The correction was largely price- and sentiment-driven, not the result of a deteriorating fundamental backdrop. A signal of how resilient the bullish thesis remains came with the June inflation report, which showed the largest monthly decline since April 2020. Silver jumped the very same day. More recently, silver led a broad precious-metals rebound, with Comex September silver rising 3.6% to $59.11 and spot silver jumping as much as 5%, its biggest intraday gain in more than five weeks after bouncing off an eight-month low near $55.50. "Today's move looks more like dip-buying than a response to new headlines," said Ewa Manthey, commodities strategist at ING, noting that silver benefits both from safe-haven demand and stronger sentiment across industrial metals as copper rallies.
The most important reason not to mistake this correction for the end of the bull market lies on the supply side. 2026 is on track to become the sixth consecutive year of a global silver deficit. The projected shortfall of around 46.3 million ounces exceeds the 40.3-million-ounce gap recorded in 2025. In other words, the deficit is widening, not closing.
This scarcity is structural and cannot be fixed quickly. Roughly 70% of silver is produced as a byproduct of lead, zinc, copper, and gold mining, meaning even materially higher silver prices do not automatically translate into more output because production hinges on the economics of the base-metal mines. Add declining ore grades at established primary silver mines, and every additional deficit year draws down finite above-ground stockpiles.
The tightness is visible on the ground. India's import restrictions have created local shortages, with dealer premiums hitting $6.50 an ounce this month, a six-month high.
While supply remains sluggish, demand continues to grow from the industrial side. Around half of silver demand comes from industrial applications, a share that makes silver both a precious and an industrial metal at the same time.
The drivers are well known and structural: photovoltaics remain a key consumer, even as some solar segments have softened recently. Increasingly stepping in are data centers for artificial intelligence, electronics for electric vehicles, and other electrification applications. This demand base is largely decoupled from day-to-day headlines; it keeps running regardless of what central banks decide in the short term.
A classic valuation tool underscores silver's relative appeal versus gold. The gold-silver ratio, the number of silver ounces needed to buy one ounce of gold, has crept back up to around 69–70:1, well above where it stood at January's peak, when silver's spike briefly drove the ratio down to 43:1.
The Silver Institute's newly released Market Trend Report, "Is the Gold:Silver Ratio Relevant Today?", produced by Precious Metals Insights, lends academic weight to what traders have long observed. Analyzing more than 3,000 years of history and price data from January 1970 to May 2026, the report confirms that the ratio is not a "random walk." Instead, it exhibits an absolute long-run, mean-reverting equilibrium of just under 60:1. Despite the massive price-scale inflation experienced by both metals over the past half century, the fundamental relationship remains bound to its central axis. Periods of extreme disequilibrium, the report argues, serve as clear signals of major over- or undervaluation, not permanent structural breaks.
Notably, the study identifies the primary driver of the ratio as the balance of above-ground gold and silver bullion stocks, working in tandem with relative investment demand, and concludes that very high central bank gold buying in recent years has likely pushed the ratio above its long-run equilibrium. History shows what happens when the ratio stretches too far. In 2020, it set a record of 123:1 amid Covid hysteria before plunging to around 60:1. Following the 2008 financial crisis, the ratio climbed above 80:1, only to collapse to 30:1 in 2011. Before last October's silver squeeze that drove the price over $50 for the first time, the ratio ran above 80:1 and even topped 100:1 in March 2025, then snapped back violently as silver surged.
At today's level, the same setup appears to be forming. The ratio can stay wide for extended periods, but if history is any indication, it will eventually revert, and silver typically closes the gap with greater leverage than gold. Interestingly, gold is finding this support despite headwinds from the official sector: Russia's central bank sold 43.5 tonnes of bullion in the first half of 2026, its biggest six-month sale in at least 25 years to plug a widening budget deficit, while Chinese wholesale gold demand sits near decade lows. That silver's physical market remains tight even as gold's official demand softens; it only strengthens the relative case.
Notably, despite a 52% correction, none of the major institutions have revised their full-year average forecast below the current price level. J.P. Morgan, for instance, anticipates an average price of around $81 per ounce in 2026, which would be more than double the previous year's average. Similarly, HSBC has recently upgraded its outlook, projecting a yearly average of approximately $75. Goldman Sachs highlights silver's close ties to the electrification and renewable energy sectors, with some analysts predicting prices could reach between $85 and $100, assuming that industrial demand remains strong. These targets reflect a considerable gap above today's price of $59, indicating that the market views the current pullback as a cyclical pause rather than a fundamental shift in the overall thesis surrounding silver. For all its structural strength, silver's future potential remains promising. Its high industrial share is both an opportunity and a risk: if worries about a global slowdown intensify, silver gets hit harder than gold. Monetary policy is another wildcard. A more restrictive tone from the Fed at its 29 July meeting, or an outright hike signal, would likely weigh on prices in the short term.
Not everyone is convinced the recent bounce will last. "After 18 days' horizontal movement there has almost certainly been some fresh buying interest," said Rhona O'Connell, head of market analysis at StoneX. However, she cautioned that gold's technical picture remains bearish and a break higher would be a surprise. Technically, the zone between $56 and $58 is considered important support, a level that held during the recent test near $55.50. On the upside, the $65 mark and then the hurdles at $68 and $76 need to be cleared before one can speak of a sustained recovery.
Anyone looking only at the price chart sees a failed rally. Anyone who adds the fundamentals sees the opposite: a widening supply deficit in its sixth consecutive year; physical shortages and record premiums in key markets like India; a broad industrial demand base around solar, AI, and electrification; a gold-silver ratio sitting well above its statistically confirmed long-run equilibrium of just under 60:1; and analyst targets that uniformly sit above today's price. None of that makes $59 a guarantee of rising prices; silver stays prone to sharp swings, and the metal remains off about 17% for 2026 even after its recent bounce. But it shifts the perspective decisively: the correction from $121 to $59 looks less like the end of a story than the starting point for its next chapter. With gold defending $4,000 and physical silver markets tightening, the metal appears once again to be on sale. And if the gold-silver ratio's 3,000-year history teaches anything, it is that such discounts rarely last forever.