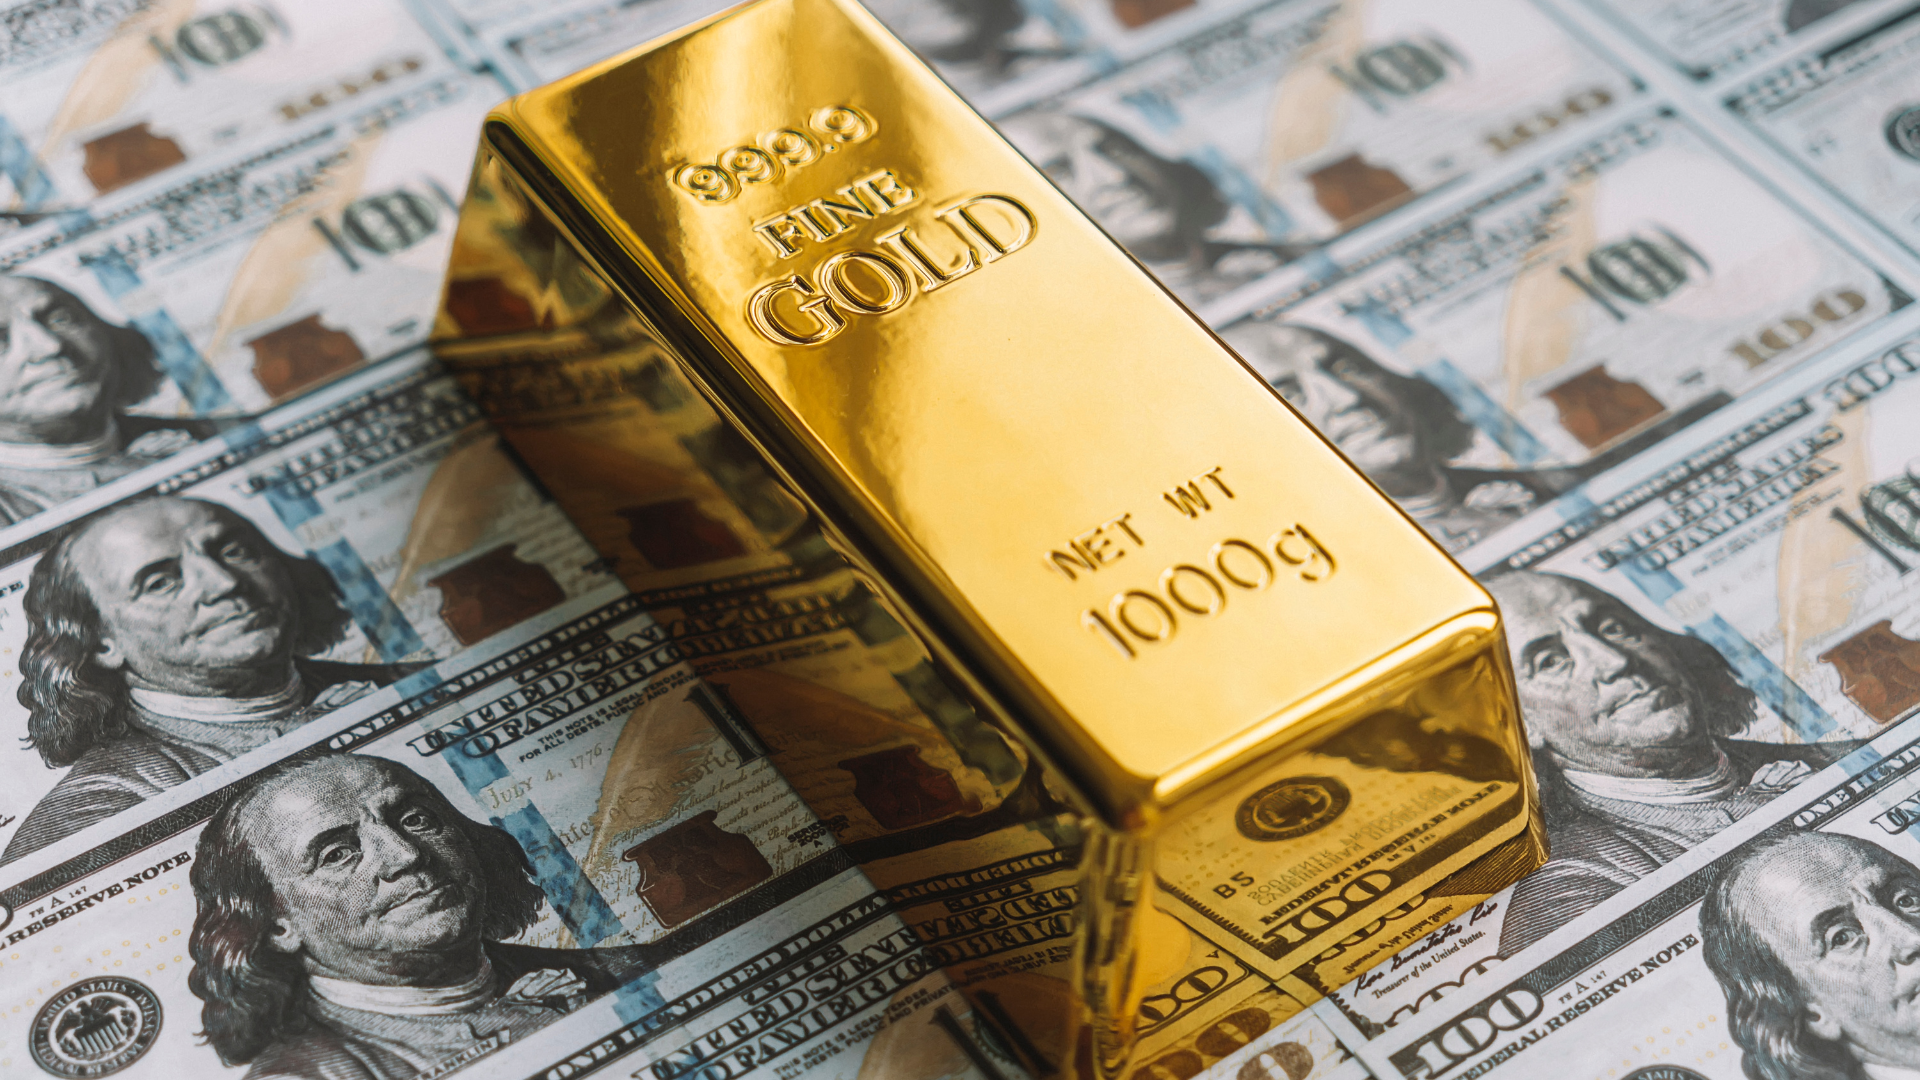
Gold prices moved back toward $4,400 per ounce on Thursday after weaker-than-expected U.S. jobless claims and softer producer inflation data pressured the dollar and Treasury yields; however, profit-taking following a two-month high limited the precious metal’s advance.
Spot gold briefly approached $4,395 after the 8:30 a.m. ET release of the weekly labor-market data and the July Producer Price Index. It later traded near $4,377, down about 0.7% on the day, after reaching $4,449 during Asian trading hours, its highest level in two months. The pullback suggests traders remain reluctant to chase prices higher following gold’s rally from around $4,000. Still, softer economic data and declining expectations for an imminent Federal Reserve interest-rate increase continue to provide underlying support.
Initial claims for state unemployment benefits rose to a seasonally adjusted 209,000 in the week ending August 8, according to the Labor Department. That was above the consensus forecast of 202,000. The previous week’s reading was revised slightly higher to 200,000 from 199,000. The four-week moving average, which smooths out weekly volatility, held at 199,000. That was higher than economists’ expectations of 197,000. Continuing jobless claims, which measure the number of people already receiving unemployment benefits, offered a more encouraging signal. They declined to 1.777 million in the week ending August 1, below expectations of 1.800 million. The previous week’s figure was revised down to 1.799 million. Taken together, the figures pointed to some softening in new unemployment claims but did not signal a sharp deterioration in the broader labor market.
Gold also received support from a softer-than-expected July PPI report. Headline producer prices were unchanged during the month after declining 0.1% in June. The annual rate slowed to 4.7% from 5.5%.
Core PPI, which excludes more volatile components, rose 0.2% month over month, down from 0.4% previously. The annual core rate eased to 4.2% from 4.7%. The data followed a broadly in-line Consumer Price Index report and a weaker-than-expected July Nonfarm Payrolls report. Collectively, the releases have reduced expectations that the Federal Reserve will raise interest rates at its September meeting. According to the CME FedWatch Tool, markets now assign a 32% probability to a September rate hike, down from 55% one week earlier.
The shift in expectations pushed Treasury yields lower and weighed on the U.S. dollar. The two-year Treasury yield fell to around 4.14%, its lowest level since July 17, while the U.S. Dollar Index slipped below 100 after touching a two-week high earlier in the session. Lower bond yields and a weaker dollar typically support gold by reducing the opportunity cost of holding the non-yielding metal and making it less expensive for buyers using other currencies.
Analysts at MUFG/BTMU said the recent CPI data supported their view that the Fed is likely to keep rates unchanged in September. However, they cautioned that markets may only slightly reduce rate-hike expectations because an increase is still possible. The analysts also pointed to elevated energy prices and the failure to reopen the Strait of Hormuz as near-term inflation risks. Meanwhile, a lack of clear forward guidance from Fed Chair Kevin Warsh has made the future direction of monetary policy more difficult to assess.
Despite Thursday’s volatility, professional analysts remain broadly constructive on gold’s longer-term outlook. A midyear survey by the London Bullion Market Association found that analysts expect spot gold to trade around $4,500 per ounce at the end of 2026. The LBMA surveyed 16 professional analysts in July, when gold was frequently trading below $4,000 and testing its lowest levels of the year.
The average year-end forecast was more than 12% above those July lows. The highest year-end prediction was $5,100 per ounce, implying an additional gain of about 15% from current prices, while the lowest forecast was $3,879, roughly $100 below the 2026 low set in early July. The analysts now expect gold to average $4,604 per ounce for the full year. Forecasts for the highest price during the second half of 2026 ranged from $4,872 to $5,800, while the lowest projected price among respondents was $3,450.
Gold averaged $4,595.75 during the first seven months of the year, approximately $135 below the full-year average projected by 28 analysts in the LBMA’s January survey. The association said its midyear update showed that expectations had moved closer to the market reality seen during the first seven months.
The main forces shaping gold have not changed materially since the start of the year, according to the LBMA. Analysts continue to focus on geopolitical instability, U.S. inflation, Federal Reserve policy, and central bank purchases. However, the emphasis has shifted toward the Fed’s direction under its new leadership. Of the 16 analysts surveyed at midyear, five identified Iran as their primary concern, one focused on sustained central-bank demand, and the remainder highlighted the Fed and its response to U.S. inflation.
The LBMA’s annual Precious Metals Analyst Survey, released on January 20, one month before the outbreak of the Iran conflict, had projected an average 2026 gold price of $4,741.97 per ounce. That forecast was 38% above the previous year’s average. It was based on expectations for lower U.S. real interest rates, continued Fed easing, and further central-bank diversification away from the dollar. The January forecasts also revealed an unusually wide range of views. Analysts’ projections ranged from a bearish low of $3,450 to a bullish high of $7,150, with a midpoint of $3,700. That range was 103% larger than the previous year’s actual price movement and more than 200% wider than the range of analyst forecasts at the beginning of last year.
From a technical perspective, gold is testing an important area around its 100-day simple moving average at $4,387. The metal remains well below its 200-day SMA at $4,502 but comfortably above its 50-day SMA at $4,145. That positioning leaves gold between medium-term support and longer-term resistance, suggesting a broadly neutral near-term outlook despite underlying bullish momentum. The 14-day Relative Strength Index stands near 65, firmly in bullish territory but not yet signaling severely overbought conditions. The Moving Average Convergence Divergence indicator also remains positive, suggesting that buying interest has not disappeared.
A sustained break above the 100-day SMA at $4,387 would bring the psychological $4,500 level into focus. That threshold closely aligns with the 200-day SMA at $4,502, making it a significant resistance zone.
On the downside, the first major support is the 50-day SMA near $4,145. The $4,000 level, below that, serves as an important psychological and structural floor. For now, declining Treasury yields and a softer dollar are likely to cushion gold’s downside. However, uncertainty surrounding the Fed, elevated energy prices, and the potential for renewed inflation could prevent a decisive move above $4,500 in the immediate term.